Introduction
Note: this post was also published in Towards Data Science.
In recent years, deep learning has revolutionized computer vision. And thanks to transfer learning and amazing learning resources, anyone can start getting state of the art results within days and even hours, by using a pre-trained model and adapting it to your domain. As deep learning is becoming commoditized, what is needed is its creative application to different domains.
Today, deep learning in computer vision has largely solved visual object classification, object detection, and recognition. In these areas, deep neural networks outperform human performance.
Even if your data is not visual, you can still leverage the power of these vision deep learning models, mostly CNNs. To do that, you have to transform your data from the non-vision domain into images and then use one of the models trained on images with your data. You will be surprised how powerful this approach is!
In this post, I will present 3 cases where companies used deep learning creatively, applying vision deep learning models to non-vision domains. In each of these cases, a non-computer vision problem was transformed and stated in such a way as to leverage the power of a deep learning model suitable for image classification.
Case 1: Oil Industry
Beam pumps are often used in the oil industry to extract oil and gas from under the ground. They are powered by an engine connected to a walking beam. The walking beam transfers rotational motion of the engine to the vertical reciprocating motion of the sucker rod that acts as a pump and transfers oil to the surface.
A walking beam pump, also known as pumpjack. Source.
As any complex mechanical system, beam pumps are prone to failures. To help with diagnostics, a dynamometer is attached to the sucker for the purpose of measuring the load on the rod. After measuring it is then plotted to produce a dynamometer pump card that shows the load across parts of the rotation cycle of the engine.
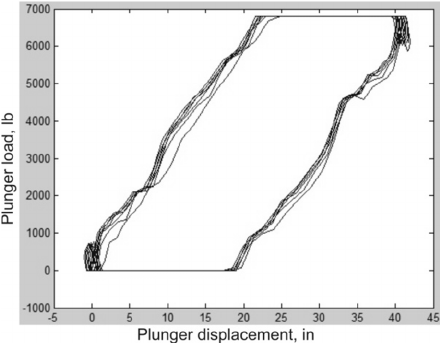
An example dynamometer card. Source.
When something goes wrong in the beam pump, dynamometer cards will change their shape. Often times an expert technician will be invited to examine the card and make a judgment call about which part of the pump is malfunctioning and what is needed to be done to fix it. This process is time-consuming and requires very narrow expertise to be solved efficiently.
On the other hand, this process looks like it could be automated, this is why classical machine learning systems were tried but did not achieve good results, around 60% accuracy.
One of the companies that applied deep learning to this domain is Baker Hughes1. In their case, dynamometer cards were converted to images and then used as inputs to an Imagenet-pretrained model. Results were very impressive - accuracy went up from 60% to 93% by just taking a pretrained model and finetuning it with new data. After further optimizations of model training, they were able to achieve an accuracy of 97%.
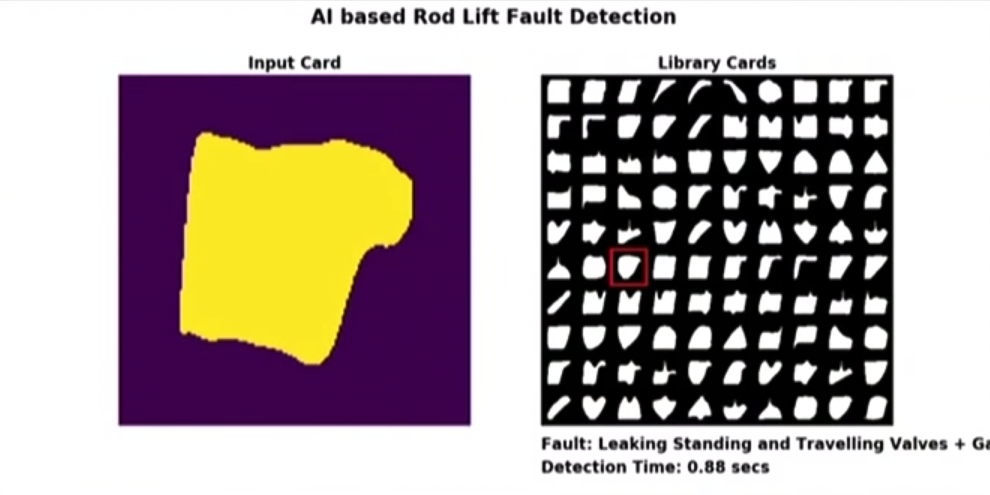
An example of a system deployed by Baker Hughes. On the left, you can see the input image, and on the right is a real-time classification of failure mode. The system runs on a portable device, and classification time is shown in the lower right corner. Source.
Not only did it beat previous classical machine learning based methods, the company now could be more efficient by not needing beam pump technicians to spend time trying to diagnose a problem. They could come and start fixing mechanical failures immediately.
To learn more, you can also read a paper that discusses a similar approach2.
Case 2: Online Fraud Detection
Computer users have unique patterns and habits when they use a computer. The way you use your mouse when you browse a website or type at a keyboard when composing an email is unique.
In this particular case, Splunk solved a problem3 of classifying users by using the way they use a computer mouse. If your system can uniquely identify users based on mouse usage patterns, then this can be used in fraud detection. Imagine the following situation: fraudsters steal someone’s login and password and then use them to log in and make a purchase at an online store. The way they use computer mouse is unique to them and the system will easily detect this anomaly and prevent fraudulent transactions from taking place, and also notify the real account owner.
Using a special Javascript code, all mouse activity can be collected. The software records mouse activity every 5-10 milliseconds. As result, data for each user can be 5000-10000 data points per user per page. The data represents two challenges: the first one is that this is a lot of data for each user and the second is that each user’s data set will contain a different number of data points, which is not very convenient because usually, sequences of different lengths require more sophisticated deep learning architectures.
The solution was to convert each user’s mouse activity on each web page into a single image. In each image, mouse movements are represented by a line whose color encodes mouse speed and left and right clicks are represented by green and red circles. This way of processing initial data solves both problems: first of all, all images are of the same size, and secondly, now image-based deep learning models can be used with this data.
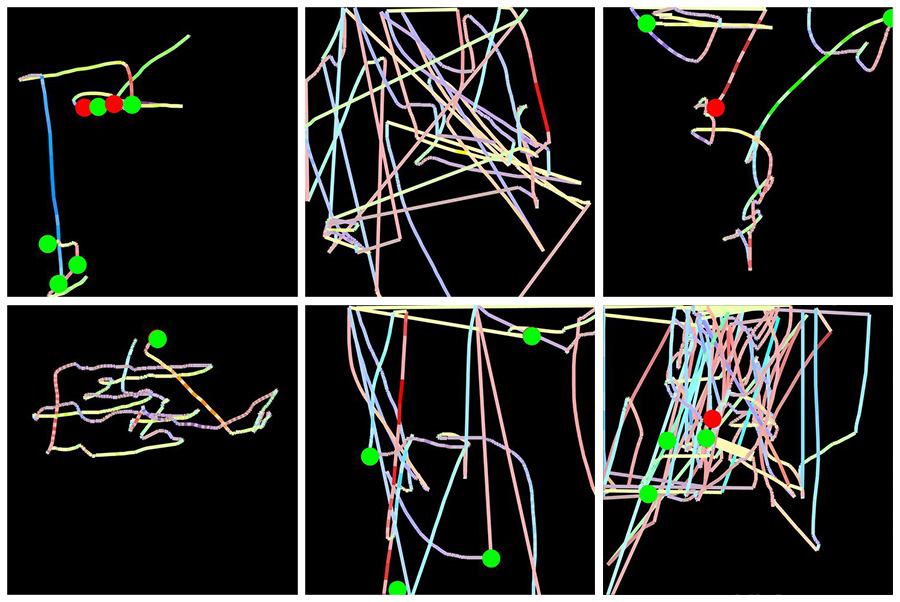
In each image, mouse movements are represented by a line whose color encodes mouse speed and left and right clicks are represented by green and red circles. Source.
Splunk used TensorFlow + Keras to build a deep learning system for classifying users. They performed 2 experiments:
-
Group classification of users of a financial services website - regular customers vs. non-customers while accessing similar pages. A relatively small training dataset of 2000 images. After training a modified architecture based on VGG16 for only 2 minutes, the system was able to recognize these two classes with above 80% accuracy.
-
Individual classification of users. The task is for a given user make a prediction whether it is this user or an impersonator. A very small training dataset of only 360 images. Based on VGG16 but modified to take account of the small dataset and reduce overfitting (probably dropout and batch normalization). After 3 minutes of training achieved an accuracy of about 78%, which is very impressive considering the very challenging nature of the task.
To read more, please refer to the full article describing the system and experiments.
Case 3: Acoustic Detection of Whales
In this example, Google used convolutional neural networks to analyze audio recordings and detect humpback whales in them4. This can be useful for research purposes, such as to track individual whale movements, properties of songs, the number of whales etc. It is not the purpose that is interesting, but how data was processed to be used with a convolutional neural network, which needs images.
The way to convert audio data to an image is by using spectrograms. Spectrograms are visual representations of frequency-based features of audio data.
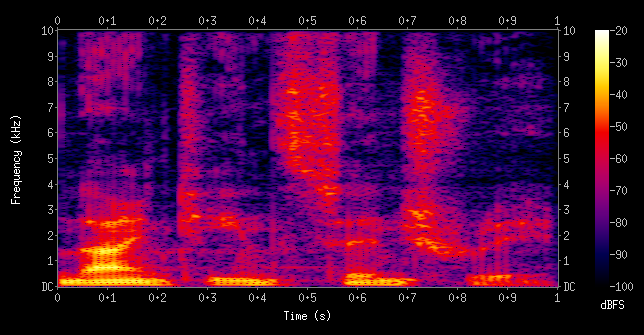
An example of a spectrogram of a male voice saying "nineteenth century". Source.
After converting audio data to spectrograms, Google researchers used a ResNet-50 architecture for training the model. They were able to achieve the following performance:
- 90% precision: 90% of all audio clips classified as whale songs are classified
- 90% recall: given an audio recording of a whale song, there is 90% chance it will be labeled as such.
This result is very impressive and will definitely help whale researches.
Let’s switch focus from whales to what you can do when working with your audio data. When creating a spectrogram, you can select frequencies to be used, and that will depend on the type of audio data that you have. You will want different frequencies for human speech, humpback whale songs, or industrial equipment recordings because in all these cases most important information is contained in different frequency bands. You will have to use your domain knowledge to select that parameter. For example, if you are working with human speech data, then your first choice should be a mel-frequency cepstrum spectrogram.
There are good packages to work with audio. Librosa is a free audio-analysis Python library that can produce spectrograms using CPU. If you are developing in TensorFlow and want to do spectrogram computation on the GPU, that is also possible.
Please refer to the original Google AI blog article to learn more about how Google worked with humpback whale data.
Summary
To summarize, the general approach outlined in this post follows two steps. First, find a way to convert your data into images and second, use a pretrained convolutional network or train one from scratch. The first step is harder then the second, this is where you have to be creative and think if the data you have can be converted to images. I hope that the examples I provided can be useful for solving your problem. If you have other examples or questions, please write them in the comments below.
References
-
IoT for Oil & Gas - The Power of Big Data and ML (Cloud Next ‘18) ↩
-
Beam Pump Dynamometer Card Prediction Using Artificial Neural Networks ↩
-
Splunk and Tensorflow for Security: Catching the Fraudster with Behavior Biometrics ↩
-
Acoustic Detection of Humpback Whales Using a Convolutional Neural Network ↩